---
title: Relational Data
date: 2018-09-20
subtitle: Joining Relational Data
reading:
- R4DS [Chapter 13 - Relational Data](http://r4ds.had.co.nz/relational-data.html){target='blank'}
tasks:
- Join two datasets using a common column
- Answer a question that requires understanding how multiple tables are related
- Save your script as a .R or .Rmd in your course repository
---
```{r setup, include=FALSE, purl=F}
options(knitr.duplicate.label = 'allow')
source("functions.R")
source("knitr_header.R")
```
# Reading
```{r reading,results='asis',echo=F,purl=F}
md_bullet(rmarkdown::metadata$reading)
```
# Background
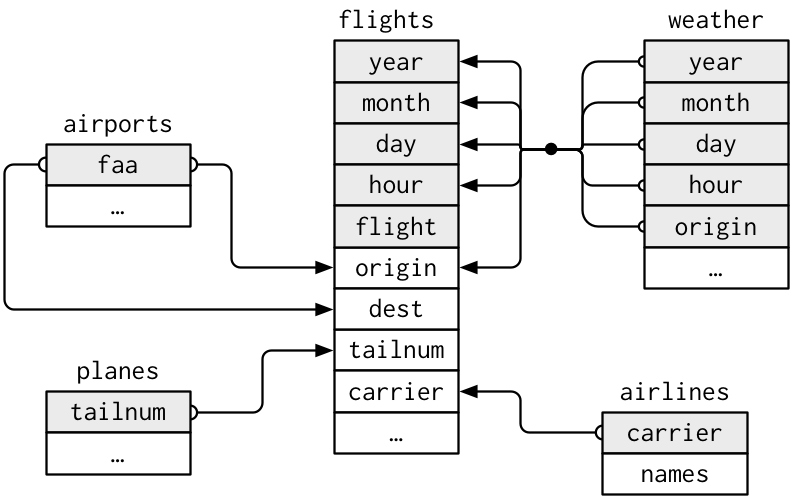
In this exercise you will use various data wrangling tools to answer questions from the data held in separate tables. We'll use the data in the `nycflights13` package which has relationships between the tables as follows.
# Objective
> What is the full name (not the three letter code) of the destination airport farthest from any of the NYC airports in the `flights` table?
# Tasks
```{r tasks,results='asis',echo=F, purl=F}
md_bullet(rmarkdown::metadata$tasks)
```
You will need to load the necessary packages
```{r, message=FALSE}
library(tidyverse)
library(nycflights13)
```
[ Download starter R script (if desired)](`r output_nocomment`){target="_blank"}
There are several ways to do this using at least two different joins. I found two solutions that use 5 or 6 functions separated by pipes (`%>%`). Can you do it in fewer?
The details below describe one possible approach.
1. Open the help file for the `nycflights13` package by searching in the "Help" panel in RStudio.
2. Look at the contents of the various tables to find the ones you need (`name`, `distance`, and `dest`). You can use `head()`, `glimpse()`, `View()`, `str()`.
2. In the table with distances, find the airport code that is farthest from the New York Airports (perhaps using `arrange()` and `slice()`)
3. Join this table with the one that has the full airport names. You will either need to rename the columns so they match the other table or use the `by` parameter in the join. e.g. check out `?left_join()`
4. `select()` only the `destName` column
Soon we will introduce working with spatial data and doing similar kinds of operations. If you have time to play, see if you can figure out what this does:
```{r, message=FALSE, purl=F}
airports %>%
distinct(lon,lat) %>%
ggplot(aes(lon, lat)) +
borders("world") +
geom_point(col="red") +
coord_quickmap()
```
Can you figure out how to map mean delays by destination airport as shown below?
```{r, echo=F, purl=F}
airports %>%
filter(!tzone%in%c("Pacific/Honolulu",
"America/Anchorage",
"Asia/Chongqing" ))%>%
right_join(flights, c("faa" = "dest")) %>%
group_by(name,lat,lon)%>%
summarize(meandelay=mean(arr_delay, na.rm=T))%>%
na.omit()%>%
ggplot(aes(lon, lat,col=meandelay)) +
borders("state") +
geom_point(size=2) +
coord_quickmap()+
scale_color_distiller(type="div",palette = "RdBu",name="Mean\nDelay\n(minutes)")
```
Adapted from [R for Data Science](http://r4ds.had.co.nz/relational-data.html#filtering-joins)