forked from AdamWilsonLabEDU/SpatialDataScience
-
Notifications
You must be signed in to change notification settings - Fork 0
Expand file tree
/
Copy pathCS_04.R
More file actions
68 lines (67 loc) · 2.94 KB
/
CS_04.R
File metadata and controls
68 lines (67 loc) · 2.94 KB
1
2
3
4
5
6
7
8
9
10
11
12
13
14
15
16
17
18
19
20
21
22
23
24
25
26
27
28
29
30
31
32
33
34
35
36
37
38
39
40
41
42
43
44
45
46
47
48
49
50
51
52
53
54
55
56
57
58
59
60
61
62
63
64
65
66
67
68
#' ---
#' title: Farthest airport from New York City
#' week: 4
#' type: Case Study
#' subtitle: Joining Relational Data
#' reading:
#' - R4DS [Chapter 13 - Relational Data](http://r4ds.had.co.nz/relational-data.html){target='blank'}
#' tasks:
#' - Join two datasets using a common column
#' - Answer a question that requires understanding how multiple tables are related
#' - Save your script as a .R or .Rmd in your course repository
#' ---
#'
#' # Reading
#'
#'
#' # Background
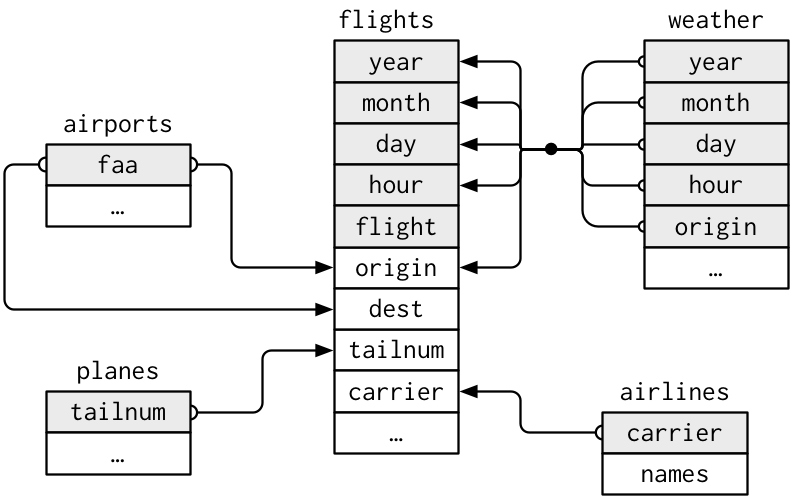
#' In this exercise you will use various data wrangling tools to answer questions from the data held in separate tables. We'll use the data in the `nycflights13` package which has relationships between the tables as follows.
#'
#' 
#'
#'
#' # Objective
#' > What is the full name (not the three letter code) of the destination airport farthest from any of the NYC airports in the `flights` table?
#'
#' # Tasks
#'
#'
#' You will need to load the necessary packages
## ---- message=FALSE------------------------------------------------------
library(tidyverse)
library(nycflights13)
#' [<i class="fa fa-file-code-o fa-1x" aria-hidden="true"></i> Download starter R script (if desired)](`r output_nocomment`){target="_blank"}
#'
#' There are several ways to do this using at least two different joins. I found two solutions that use 5 or 6 functions separated by pipes (`%>%`). Can you do it in fewer?
#'
#' <div class="well">
#' <button data-toggle="collapse" class="btn btn-primary btn-sm round" data-target="#demo1">Show Hints</button>
#' <div id="demo1" class="collapse">
#' The details below describe one possible approach.
#'
#' 1. Open the help file for the `nycflights13` package by searching in the "Help" panel in RStudio.
#' 2. Look at the contents of the various tables to find the ones you need (`name`, `distance`, and `dest`). You can use `head()`, `glimpse()`, `View()`, `str()`.
#' 2. In the table with distances, find the airport code that is farthest from the New York Airports (perhaps using `arrange()` and `slice()`)
#' 3. Join this table with the one that has the full airport names. You will either need to rename the columns so they match the other table or use the `by` parameter in the join. e.g. check out `?left_join()`
#' 4. `select()` only the `destName` column
#' </div>
#' </div>
#'
#'
#'
#' <div class="extraswell">
#' <button data-toggle="collapse" class="btn btn-link" data-target="#extras">
#' Extra time? Try these extra activities...
#' </button>
#' <div id="extras" class="collapse">
#'
#' Soon we will introduce working with spatial data and doing similar kinds of operations. If you have time to play, see if you can figure out what this does:
#'
#'
#' Can you figure out how to map mean delays by destination airport as shown below?
#'
#'
#' </div>
#' </div>
#'
#' <i> <small> Adapted from [R for Data Science](http://r4ds.had.co.nz/relational-data.html#filtering-joins) </small> </i>