Bar chart grouped type not working #1646
Description
Describe the bug
I am trying to create a grouped bar chart following the examples here. The grouped bar chart does not work with bqplot v0.12.43. However, it works fine when downgrading it to a much older version, such as v0.12.30.
To Reproduce
import numpy as np
import bqplot.pyplot as plt

fig = plt.figure(title="Stacked Bar Chart")
x = list("ABCDE")
y = np.random.rand(3, 5) # 2d array

grouped_bar = plt.bar(x, y, type="grouped", padding=.4,
                      colors=["orangered", "steelblue", "limegreen"])

fig
Expected behavior
It should look like this with bqplot v0.12.30
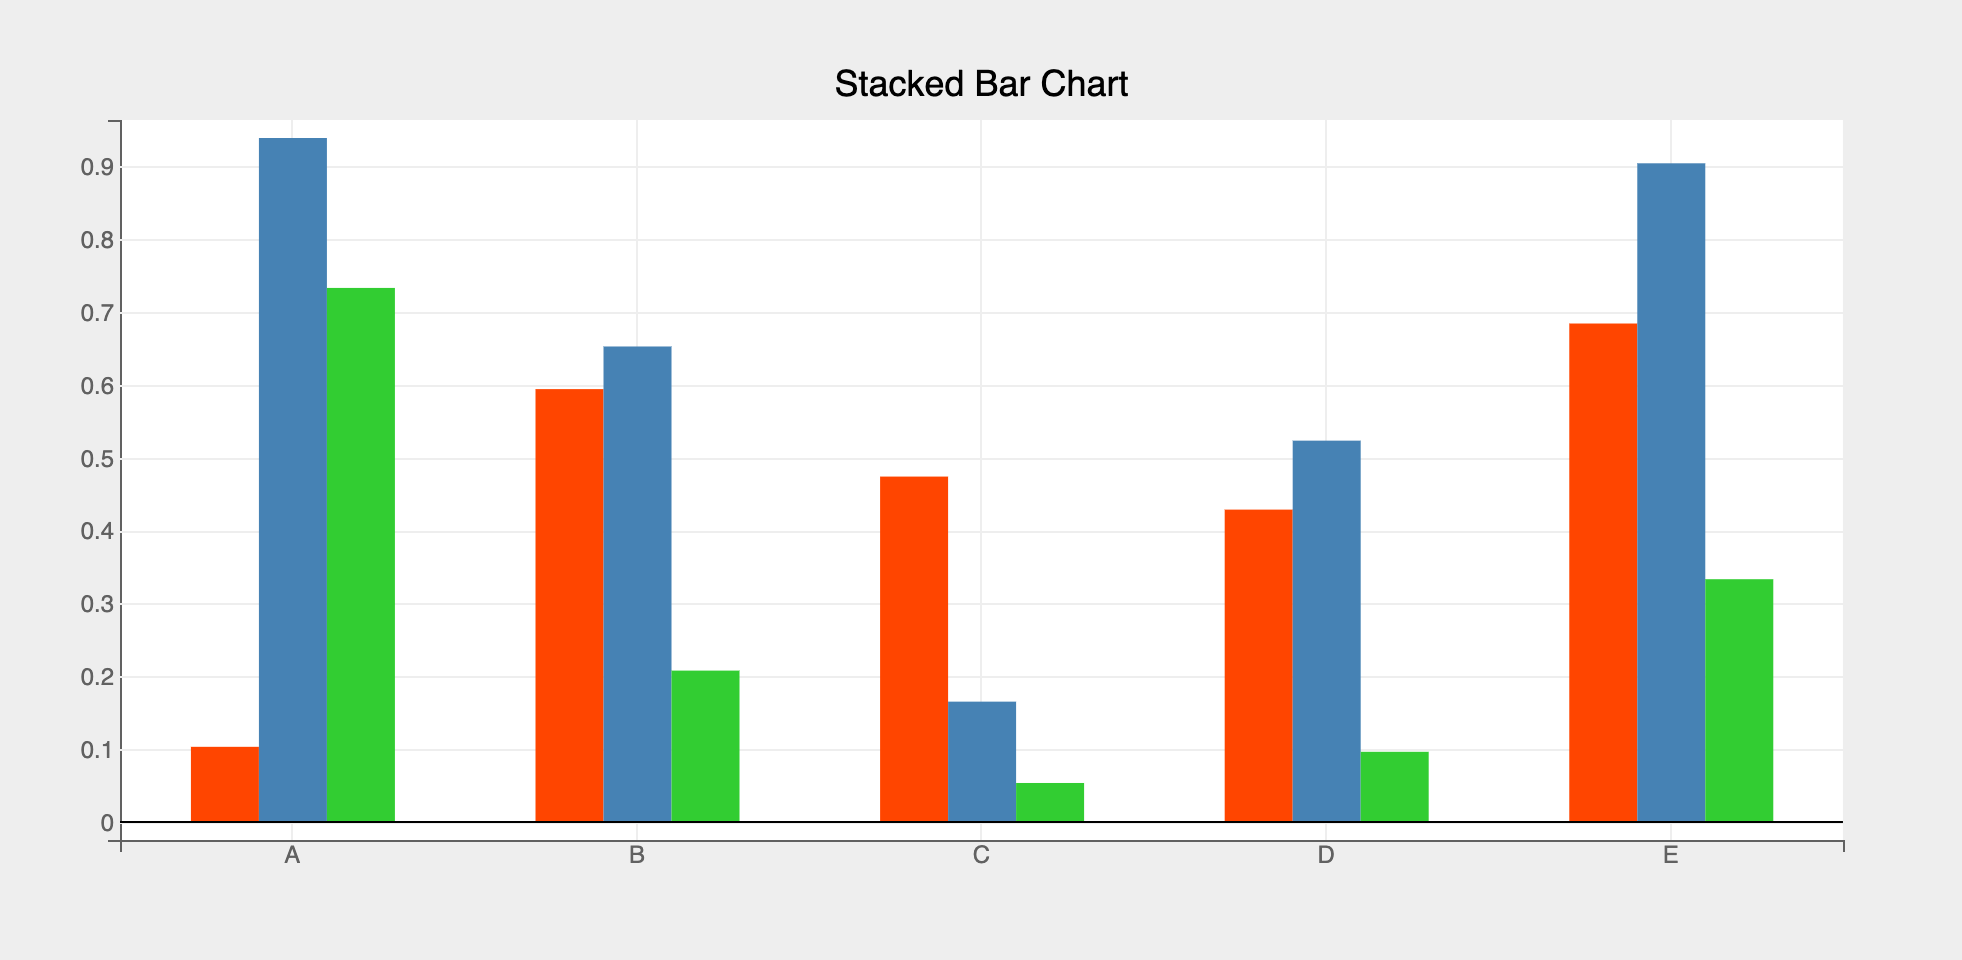
Screenshots
It should look like this with bqplot v0.12.43
